Table of Contents
Nowadays the scope of statistics is very wide. It has been described as ‘key technology’ by R. A. Fisher, as it is indispensible in almost every major spheres of life and work.
For a person to be an effective citizen, it is no longer sufficient to be literate in the generally accepted sense of the term, a person must be ‘quantitatively literate’ or ‘numerate’. ‘Numeracy’, like ‘literacy’, has many different facets, but what is most important is feeling comfortable with numerical information or data. The broader definition of numeracy or “Quantitative Literacy” (QL) now in use is “an aggregate of skills, knowledge, beliefs, dispositions, habits of mind, communication capabilities, and problem-solving skills the people need in order to engage effectively in quantitative situations arising in life and work”.
“What do the data say?”. It helps us think critically about everyday life. For example, with the help of statistics, we can determine which batsman is more consistent in scoring, which brand of light bulb is lasting longer, which political party is doing better for the country, which drug is more effective in reducing headache, which fertilizer is more productive, what fraction of potential buyers prefer Maruti Zen to Santro, etc.. It can also be noted that the economists and financial advisors, as well as the policymakers in government and business study data in order to make informed decisions. Doctors study data that appear in medical journals for treating their patients more effectively. Politicians need data on polls and public opinion. Engineers often study data on the quality and reliability of the manufactured products.
Data is defined as known or assumed facts and figures from which conclusions can be drawn. Data are used to make decisions, to support decisions already made, to provide reasons behind the happening of certain events, and to make predictions of events to come. Some kind of analysis is required to convert data into information.
Meaning of Statistics
Statistics means “numerical description” of facts to most people and in common usage. The term ‘Statistics’ has dual meanings. “Statistics”, in the plural sense, means data, that is, the numerical information arising out of the events in connection with any sphere of human experience when a host of uncontrolled (mostly unknown) causes are acting together, for example, the amount of toxic waste (like DDT) discharged by chemical and manufacturing plants in a nearby creek, the scores of a group of students in Statistics, the defective status (defective or non-defective) of each of the twenty computers in a school after one year from the date of installation, etc.. On the other hand, Statistics, in singular sense, refers to the field or discipline of study. It deals with the methods of analysis of data. In this sense, Statistics is defined as the scientific methods required for collecting, classifying, summarizing, analyzing, and interpreting numerical information.
Recently a new definition of Statistics has evolved. This definition defines Statistics not as a body of methods, nor as a collection of data, but as an activity. lt says that Statistics is to increase our understanding to promote human welfare and to improve our quality of life and well-being by advancing the discovery and effective use of knowledge from data — data with all their uncertainty, variability, and fallibility.
Regarding the methodology used in the analysis of data, two broad areas of Statistics can be identified. These two branches of Statistics are :
- 1. Descriptive Statistics
- 2. Inferential Statistics
In a data set, the main problem is to describe and extract information from a large mass of data. The branch of Statistics concerned with this type of problem is called Descriptive Statistics. This branch of Statistics provides us with numerical and graphical methods to look for the patterns in the data set. It deals with the collection, organization, summarization, and presentation of data in a convenient form. Inferential Statistics discusses the ways of making predictions or drawing conclusions about population characteristics based on the data collected.
Misuses of Statistics

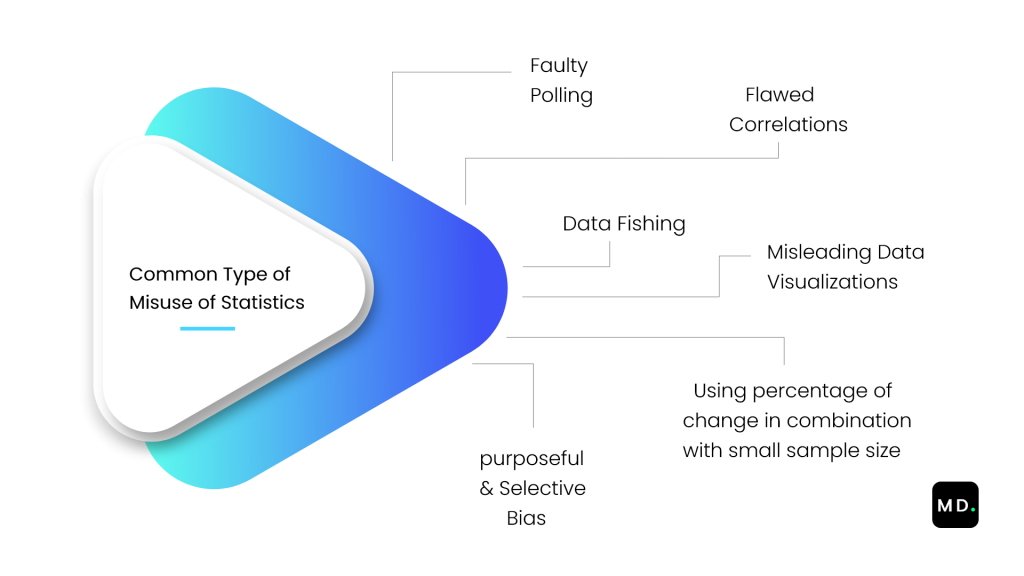
There are some sayings like “there are three kinds of lies: lies, damn lies, and Statistics” (according to British politician Benjamin Disraeli in the Nineteenth-century) or “An ounce of truth will produce tons of Statistics” etc.. Really figures and numbers cannot lie. Wrong pictures may come out due to fallible data or misinterpretation. Statistics is rather useful in extracting and establishing the truth behind the data, but it must be used for in proper perspective. Let us discuss the following examples :
Example 1.1
Air travelers would like the airlines whose flights are arriving on time. Keeping this in view, airlines collect data on the arrivals of their planes and report the data to the concerned department. Data on flight arrivals from several cities for two airlines are shown below for the last six months. Which airline performed better? — Comment on the basis of the data given in Table 1.1 and Table 1.2 below.
Table 1.1 : Summary data on on-time and delayed flights for airlines
A and B
| On time | Delayed | ||
| Airline A | 3274 | 501 | |
| Airline B | 6438 | 787 |
Now, the percentage of late flights for the two airlines arc as follows :
Airline A: (501 / 3775) x 100 – 13.3%
Airline B: (787 / 7225) x 100 = 10.9%
It appears that airline B is doing better, since it has less percentage of delayed flights.
Next, let us consider the entire last six months’ data on “on-time and delayed flights” from different cities where airlines A and B operate. The data are as follows :
Table 1.2 : Citywise “on-time and delayed flights” or airlines A and B
| Airline A | Airline B | |||
| On-time | Delayed | On-Time | Delayed | |
| City I | 497 | 62 | 694 | 117 |
| City II | 221 | 12 | 4840 | 415 |
| City III | 212 | 20 | 383 | 65 |
| City IV | 503 | 102 | 320 | 129 |
| City V | 1894 | 305 | 201 | 61 |
| Total | 3274 | 501 | 6438 | 787 |
It is also known that City II was mostly sunny and City V was mostly rainy and foggy during the six month period of data collection. Now, let us see the percentage of delayed flights for individual cities.
City I:
Airline A : (62/559) x 100 = 11.1%
Airline B: (117 / 811) x 100 = 14.4%
Clearly, in City I airline A is performing better.
City II:
Airline A: (12/233) x 100 = 5.2%
AiriineB: (415 / 5255) x 100 = 7.9%
In City II also, airline A is doing better than airline B.
Similarly, for all the cities we can see that the percentage of delayed flights is less for airline A compared to airline B. So, how come it is possible that airline A wins at every city, but airline B wins when we combine data from all the cities? If we look at the data critically we can see that most of the flights of airline B are arriving at City II, which is mostly sunny and there are few delays, whereas most of the flights of airline A are arriving at City V, where rain and fog cause a frequent delay. Hence the inclusion of the information on climate (rainy and foggy or sunny) for these cities change the scenario and reverse the conclusion. If the data are not critically examined in relation to all other relevant information, then there is a chance that the data would support a conclusion which does not reflect the real scenario.
The reversal of the conclusion when data are combined from several sources or groups is called Simpson’s paradox or reversal paradox. When data from several sources or tables are combined into a single table, there is always a possibility that some unreported variables may cause a reversal of the findings. These variables are called lurking (or confounding) variables. In Example 1.1 the climate (rainy and foggy or sunny) of the flight arriving cities are ignored and thus acts as a lurking variable.
Scope of Statistics

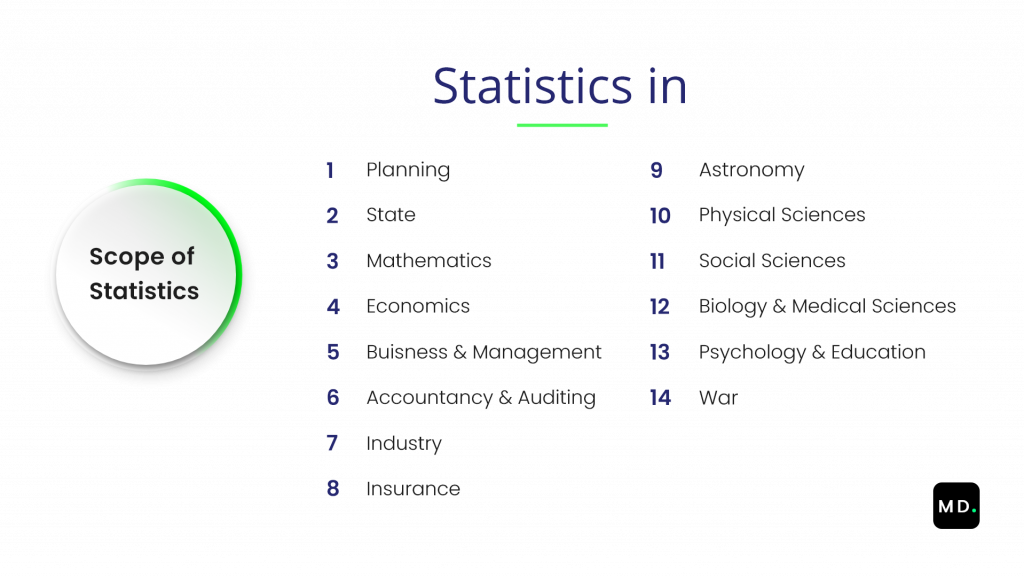
Statistics is a fundamental and invaluable part of the infrastructure of other sciences. Since it is relevant to many other scientific disciplines, Statistics can serve as an integrative force among them. Statistics can build bridges, translate the different disciplinary languages and perspectives into a common understanding of their data, and create synergy.
Statistics have the potential to significantly further the contributions of science to society through interdisciplinary research.
Statistical methods are useful in determining trends of growth in business, in making production plans, etc. In industry, statistics are used in controlling quality and improving the reliability of products.
The importance of statistics in engineering and management science is felt like the quality improvement aspect becoming more and more essential. It is easy to realize that the poor quality of products in the form of manufacturing defects or unsatisfactory product reliability may affect the overall productivity significantly.
Statistics can effectively be used to carry on a successful quality improvement program, which, in turn, can eliminate waste, reduce scrap and rework, reduce the requirements for inspection and test, increase customer satisfaction, etc..
It is not only useful to business, commerce, and industry, but in social, economic, and political spheres too.
Statistics have wide applications in the field of biological, physical, and medical sciences. Doctors and other health professionals may evaluate the results of their studies related to new drugs and therapies with the help of statistical tools and techniques.
The use of Statistics in government planning, agriculture, psychology, education, astronomy, even in war is also noteworthy. Recently Statistics has been used very effectively in astrophysics to support the big-bang theory of the creation of the universe.
Statistics can be used everywhere whenever the data appear with a certain kind of random phenomenon. But we must remember that the conclusions drawn using statistical methods are true only on an average; they may not be exactly the same for each and every situation.
Central Tendency |


